
Partial Discharge Measurement Pays Big Dividends
Don A. Genutis, No-Outage Electrical Testing, Inc. & Neil Davies, EA Technology
Introduction
Just like people, electrical assets age and deteriorate; and as with human medicine, there have been tremendous advances in recent years in the ability to diagnose in the early stages ailments suffered by assets, enabling us to keep them healthy and productive longer.
The revolution in asset management is being driven by two factors which are inextricably linked: new techniques for accurately measuring the condition of live assets, plus new methodologies for managing assets more effectively, based on their actual condition.
There are many techniques available for assessing the condition of live assets including transformer oil analysis and thermal imaging. But the most useful is the detection, location, and measurement of partial discharge (PD) activity in medium- and high-voltage assets, which are typically found in substations.
The collection of condition data using PD instruments has become standard practice in the UK electricity industry, an innovation which has been driven in large part by the need for operators to provide detailed evidence of the state of their assets to the electricity regulator, Ofgem. In other parts of the world, notably the Middle East, China, and Singapore, PD investigations have been taken up with great enthusiasm as a cost-effective means of improving network reliability and performance (see examples below).
Surprisingly, however, detailed PD measurement as the basis of condition-based asset management is still in its infancy in many parts of the developed world, including the USA. Many operators still have no clear information on the condition of their assets until they fail completely and must be replaced. Unlike the world’s most efficient network operators, such as Singapore’s SP Powergrid, they accept unpredicted asset failures and loss of customer service as a fact of life.
Understanding PartialDIscharge (PD)
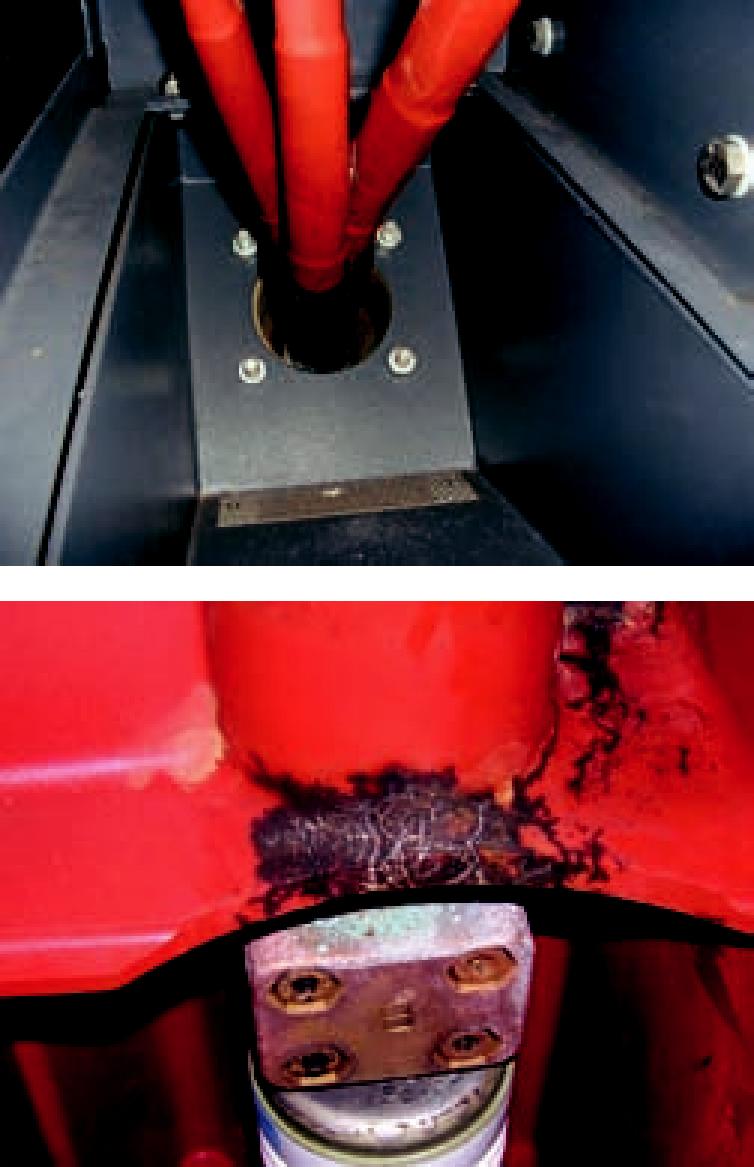
Figure 2: Visible evidence of PD
What is PD?
A partial discharge is an electrical discharge or spark that bridges a small portion of the high voltage insulation between two conducting electrodes or a conducting electrode and earth. Partial discharge can occur at any point in the insulation system where the electric field strength exceeds the breakdown strength of the insulating material.
Partial discharge can occur in voids within solid insulation, across the surface of insulating material due to contaminants or irregularities, within gas bubbles in liquid insulation, or around an electrode in gas (corona activity).
What causes PD?
There are many causes of breakdown in insulation which lead to PD activity including design and manufacturing defects, incorrect installation of components, faulty materials, mechanical damage, and even vandalism. Even well designed and installed assets start to exhibit PD activity as they deteriorate with age and usage.
Environmental factors also play a role in the development of PD activity including temperature, humidity, atmospheric pressure, vibration, and other mechanical stresses.
PD Failure Process
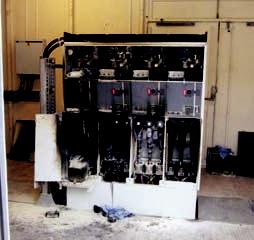
Figure 3: Catastrophic failure caused by partialdischarge activity
Once present, partial discharge always increases, but the way in which it increases is both measurable and predictable.
Industry experience of working with network assets for more than 30 years shows that PD activity is a factor in 85 percent of disruptive substation failures. It has thus become increasingly apparent that the ability to detect and measure PD is the key to assessing the health of assets.
PD activity provides clear evidence that an asset is deteriorating in a way that is likely to lead to failure. The process of deterioration can propagate and develop until the insulation is unable to withstand the electrical stress, leading to flashover.
The ultimate failure of medium- and high-voltage assets is often sudden and catastrophic. The best case scenario is that growing PD activity causes protection systems to trip out unexpectedly resulting in outages. The worst case scenario is an explosive release of energy, causing major damage, injury, and death.
Pd Detection & MeaSurement

Figure 4: PD activity across insulator voids in gasinsulated switchgear (GIS)
Partial discharges emit energy, the effects of which can be detected, located, measured, and monitored:
- Electromagnetic emissions in the form of radio waves, light, and heat
- Acoustic emissions in the audible and ultrasonic ranges
- Ozone and nitrous oxide gases
The most effective techniques for detecting and measuring PD activity in live assets are based on quantifying the following:
Transient Earth Voltages (TEVs)
The importance of TEV effects (discharges of radio energy associated with PD activity) was first identified by EA Technology researchers in the 1970s Measuring TEV emissions is the most effective way to assess internal PD activity in metal-clad, medium-voltage switchgear.
Ultrasonic Emissions
PD activity creates emissions in both the audible and ultrasonic ranges. The latter is by far the most valuable for early detection and measurement. Measuring airborne ultrasonic emissions is the most effective way to assess surface PD activity, where there is an air passage, e.g., vents or doors in the enclosure of an asset. Where chambers are completely sealed, ultrasonic contact probes can be used although these are less sensitive than the airborne microphones.
UHF Emissions
PD activity can also be measured in the UhF range and is particularly useful in monitoring extra high voltage (EHv) assets.
PD MEASUREMENT INSTRUMENTS AND SYSTEMS
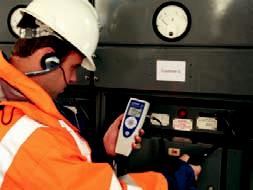
Figure 5: The latest handheld instruments measure PDactivity as both ultrasonic and TEV emissions
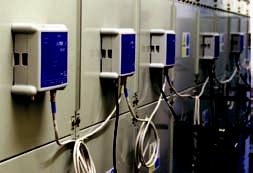
Figure 6: New multiple sensor systems continuously monitor assets for critical PD activity, record data, and automatically trigger alarms if activity exceeds acceptable thresholds
First Generation Instruments
The first generation of PD measurement instruments appeared in the 1980s and was mostly based on measuring TEV effects. Several specific instruments were required to detect, locate, and monitor PD activity, and by present standards they were cumbersome and expensive. Some relatively simple ultrasonic instruments were also developed.
Second Generation Instruments
2003 saw the launch of the first hand-held PD detector, which measured PD activity using both ultrasonic and TEV sensors. This was followed by more sophisticated dual sensor instruments, capable of gathering detailed quantitative data on PD activity, together with fixed PD alarm systems.
Third Generation Systems
Third generation PD products have developed over the last two years into multiple sensor systems with unprecedented abilities to detect, locate, measure, quantify, and record PD activity. They effectively combine all the technologies of the earlier generation instruments into packages which are easier to use, more versatile, and provide far greater depth of condition data at lower cost.
For example, the latest portable PD location system embraces no fewer than six sensor technologies: measuring ultrasonic emissions, TEV effects, temperature, humidity, and atmospheric pressure, together with a radio frequency current transformer (RFCT) sensor which specifically measures PD activity in cables.
The latest PD monitoring systems also use multiple sensors and are designed to provide permanent or semipermanent monitoring of mission critical assets. A single system can simultaneously monitor hundreds of assets, recording and analyzing PD activity over time to give a comprehensive picture of condition. The systems also function as 24/7 alarms, automatically generating alerts if PD activity exceeds set limits. A specific variant has also been developed for gas insulated switchgear (GIS) assets.
The Value of Partial Discharge Data
The latest PD instruments and systems are extremely valuable for identifying faults as they develop at an early stage preventing them from developing into failures – the quick health check approach. But the information they gather is also playing a major part in transforming the industry’s approach to asset management from one based on time-scheduled maintenance and replacement to one based on a detailed understanding of the condition of the asset base.
Maximizing the value of PD data is essentially carried
out at two levels:
Asset Condition Registers
Expert analysis and interpretation of PD activity readings
gives a clear indication of the condition of assets including accurate predictions of when they are likely to fail. This is based on a unique database, built up over more than 30 years, which shows how tens of thousands of asset types have deteriorated over time.
This approach enables operators to develop registers of assets in which each asset is accorded a health index showing its present condition, its predicted date of failure, and/or its remaining service life.
There is strong evidence that basing maintenance and replacement on actual condition is far more cost effective than time-scheduled interventions or a running until failure approach. This is because condition based regimes:
- Prevent expensive, unexpected failures.
- Prevent needless invasive maintenance, which is costly, disruptive and often creates more faults.
- Enables operators to prioritize expenditure on a strictly as needed basis.
Condition Based Risk Management (CBRM)
The ability to measure the condition of live assets is the key to CBR M, a comprehensive new methodology which takes condition based asset management to a higher level, enabling managers to make more intelligent decisions on asset renewal strategies.
The effectiveness of CBR M derives from factoring together probability (based on asset condition) and consequences (based on quantifiable losses) of asset failure to determine risk in terms of financial cost.
CBRM provides the answers to the key questions:
- If an asset costing $XX fails, what will be the consequential loss to the business?
- If an asset is refurbished or replaced at a cost of $YY , what will be the benefit to the business?
- Therefore, where should we prioritize our asset renewal spending?
EXAMPLES: Operators Using PD Measurement as Part of Condition-Based Asset Management
SP Powergrid, Singapore
SP Powergrid’s network includes nearly 10,000 substations, 40,000 switchgear sets, 14,000 transformers and 30,000 km of cable. Since incorporating condition monitoring into its systems, it has dramatically improved an already excellent performance. The company’s system average interruption duration Index (SAIDI) averaged less than 1 minute pa over a recent three year period.
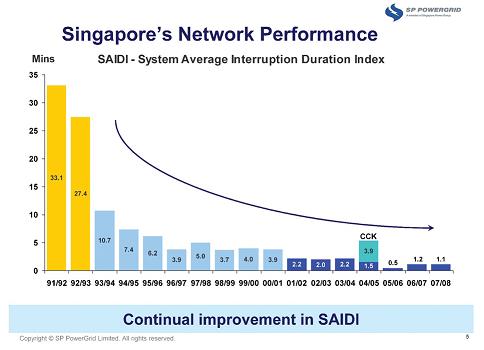
Figure 7: NB: The blip in 2004/5 was caused by a third party supply issue outside SP Powergrid’s control.
SP Powergrid estimates that over the eight financial years to 2008, condition monitoring enabled it to avert 450 network failure incidents with a net financial saving of US$29 million. In addition to improving customer service, it has been able to pass cost savings on to them.
CLP Hong Kong
The China Light and Power network in Hong Kong includes nearly 13,000 substations and 22,000 km of overhead lines and underground cables serving 2.26 million customers.
As a result of focusing over the last 10 years on condition based maintenance, to predict faults and improve reliability, it has reduced its SAIDI figures from more than 40 to 2.68 minutes lost per year.
Demand from customers has continued to grow, but in recent years, greater operating efficiencies have enabled CLP to reduce tariffs
Conclusion
The ability to assess the condition of medium- and high-voltage assets by measuring PD activity is increasingly driving a step change in power asset management. At its simplest level, it enables operators to identify and fix faults before they develop into failures. Used to its full extent, it is one of the technologies behind much more effective management of whole networks, based on greater understanding of asset condition. The result: greater network efficiency, availability, reliability and safety, with lower capital and revenue costs.

Don Genutis
-founded and acts as President of No-Outage Electrical Testing, Inc. (www.NoOutageElectricalTesting.com) which focuses on new inspection technologies that are performed while the equipment remains in service.
-founded and acts as President of No-Outage Electrical Testing, Inc. (www.NoOutageElectricalTesting.com) which focuses on new inspection technologies that are performed while the equipment remains in service.
Special thanks to Neil Davies, Director of International Business Development for EA Technology for contributing this paper. Based in the UK, EA Technology has offices in Shanghai, Abu Dhabi, Australia and the USA, together with more than 30 distribution partners serving 80 countries.
Recent Comments